June 1, 2009 2:30 PM
Developers bank a lot on their IDE. Any minor improvement to the
environment that aids them in building applications is always welcome.
Flex developers, rejoice! A public beta of the next version of Flex
Builder called Adobe Flash Builder 4 is out with a long list of new
features and improvements over existing ones.
Adobe Flash Builder 4 Beta (formerly called Flex Builder) is out at
Adobe Labs. In this post, I will take a detailed look at Network
Monitor, which allows you to inspect the HTTP traffic between your
Flex application and the server.
Wireshark this, Fiddle that
Developing client side applications require you to inspect the actual HTTP traffic at some point or the other. This is especially true in the case of Flex apps1 where you don't get the actual HTTP response data back in the case of HTTP errors like 500 or 404.
Ethereal, Wireshark, etc. is a great tool for monitoring network traffic and troubleshooting communication problems. But these tools can't sniff localhost (in Windows) or SSL traffic.
The solution in such cases is to use a local HTTP proxy tool such as Fiddler or Charles. But even then, these tools cannot narrow down requests from other programs and neither can they correlate between the HTTP request and the source code that invoked the request.
How awesome would it be if you could do this right from Flash Builder?
It would be super cool! Enter "Network Monitor"
Network Monitor
The minute I heard of this feature, the first thing that came to my mind is "Goodbye Stream error"2.
There's a tab called Network Monitor in the bottom part of Flash Builder 4 along with tabs to Problems, Data / Services, ASDoc, Console. Switch to the Network monitor tab to see what the exact request your Flex app is sending and what response the server gave (HTTP headers and body).
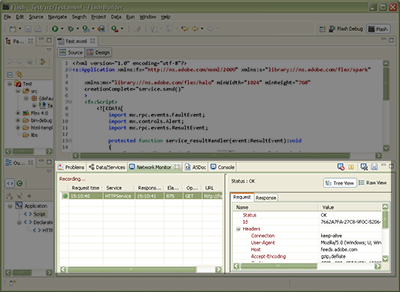
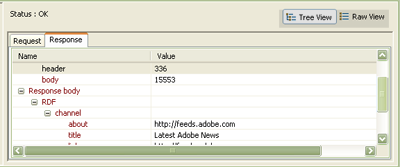
- Responses from the server can be viewed inline as a tree when the response is XML or AMF (yes, transparent AMF decoding!). The power users can always see the raw response in its entirety.
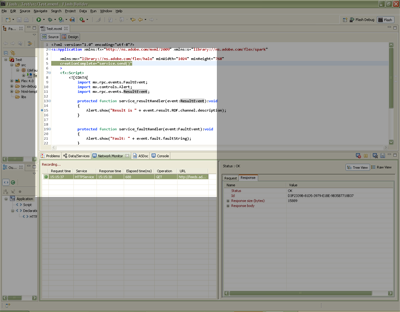
- You can also double click a request in the view and it will take you to the correct line in the source code from where that request was made. This is awesomeness for me and there's no way you could do that with Fiddler / Wireshark.
Tips for using Network Monitor
- You can disable or suspend Network monitor at any point by pressing the appropriate buttons on the top right of the network monitor tab.
- Clicking the elapsed time column to sort the requests according to the elapsed time can quickly tell you which request is taking the least time and which the most.
- There's also this nifty feature where you can save the entire request / response data along with elapsed time, associated source code, etc. to an XML file.
How does it do that?
Network monitor works by conditionally enabling code in the Flex SDK (depending upon whether Network monitor is enabled or not) that re-routes the Flex RPC calls to an internal proxy. This proxy makes the outward HTTP request. Therefore, it can report the actual HTTP request and response and is not bound by the several security and transformation rules that the Flash Player enforces on network requests.
This is important to understand because:
- Only the Flex RPC APIs will be re-routed to the proxy and reported in Network Monitor.
It does not intercept the low-level flash player APIs. For that, you'd still have to depend on other tools.
Writing a Simple HTTPService Application in Flex SDK 4
Try out Network Monitor using this simple application that uses an HTTPService to query the AXNA RSS:
<?xml version="1.0" encoding="utf-8"?> <s:Application xmlns:fx="http://ns.adobe.com/mxml/2009" xmlns:s="library://ns.adobe.com/flex/spark" xmlns:mx="library://ns.adobe.com/flex/halo" minWidth="1024" minHeight="768" creationComplete="service.send()"> <fx:Script> <![CDATA[ import mx.rpc.events.FaultEvent; import mx.controls.Alert; import mx.rpc.events.ResultEvent; protected function service_resultHandler(event:ResultEvent):void { Alert.show("Result is " + event.result.RDF.channel.description); } protected function service_faultHandler(event:FaultEvent):void { Alert.show("Fault: " + event.fault.faultString); } ]]> </fx:Script> <fx:Declarations> <mx:HTTPService id="service" url="http://feeds.adobe.com/xml/rss.cfm?query=byMostRecent&languages=1" result="service_resultHandler(event)" fault="service_faultHandler(event)" /> </fx:Declarations> </s:Application>
Tip: In Flash Builder 4, you don't have to hand code this, try out the DCD HTTPService wizard. For a long list of excellent Flash Builder 4 data-centric development3 related articles and demos, keep a watch on the Flash Builder 4 page on Sujit's blog.
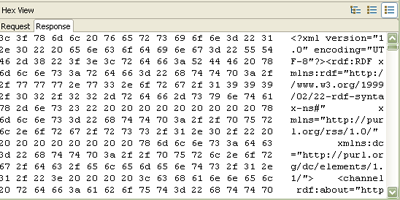
Update: In Flash Builder 4 Beta 2, Network Monitor comes with "Hex View", which is an invaluable view to have while inspecting binary response data from the server:
[1] You get an "Error 2032- Stream Error" because the browser might
not give the error response code or body to the plugin.
[2] Yes, I know that it the monstrous Stream error will not go away,
but I will get to see why I got that without running a third party
tool.
[3] There's a Data/Services tab with which you can connect to various
server side backends in a wizard workflow to define a service.
This service can be dragged and dropped on to a UI component.